Summary Description of LBC
The Large Binocular Cameras (LBC) are two wide-field cameras that are mounted on the prime focus swing arms of the LBT. The LBC Blue is mounted above the left (SX) mirror and is blue-optimized for observations from approximately 3500 to 6500 angstroms, while the LBC Red is mounted above the right (DX) mirror and is red-optimized for observations from approximately 5500 angstroms to 1 micron (see available filters below). The LBCs are designed to be used simultaneously, but can also be run independently. Technical chips in the focal plane are used to guide (tech chip \#1) and to correct focus in between exposures (tech chip \#2). Pointing corrections determined from the guiding are made by both the mount and by tip/tilt adjustments of the mirrors.- Focal Plane Layout
- Filters
- Detector Quantum Efficiency
- Detector Characteristics
- Zero Points and other Calibration Coefficients
- Sensitivities
- Instrument Web Pages at Osservatorio Astronomico di Roma, Monte Porzio
Focal Plane Layout
The LBC focal plane consists of four EEV42-90 CCDs (2048 x 4608 pixels, 13.5 microns x 13.5 microns per pixel) arranged such that three of the chips are butted along their long edges, with the fourth chip rotated counterclockwise by 90 degrees and centered along the top of the other CCDs. The three CCDs that are arranged with their long edges together are numbered from right to left, chip #1 to chip #3, the top rotated CCD is chip #4. There are two technical chips (2048 x 512 pixels) on either side of the focal plane array. The one closest to chip #1 is used for guiding and the one closest to chip #3 is set 0.8 mm below the focal plane to produce out-of-focus pupil images which are analyzed automatically to adjust focus in between exposures.
The image below shows the relative positions of the four science and two technical detectors for LBC Blue (left) and LBC Red (right). In this image chip #1 is at the bottom, chip #3 at the top and chip #4 on the right. The circles denote radii of the corrected fields (black circles) and percentage vignetting at a given radius (blue, green and red circles).
At the f/1.45 LBC focus, the focal plane scale is 16.9 arcsec/mm, and, thus,
the average pixel scale for both LBC Blue and LBC Red is 0.2255 arcsec/pixel.
Each CCD covers approximately 7.8 arcmin x 17.6 arcmin,
with gaps between the chips of ~18 arcseconds (70 pixels).
The science field of view is approximately 23 arcmin x 25 arcmin.
More information can be found in the reference paper for LBC-Blue, "The performance of the blue prime focus large binocular camera at the large binocular telescope", Giallongo, E. et al. (2008),A&A, 482, 349.
Back to TopFilters
There are two filter wheels in each LBC. The filter wheels and the cryostat are all mounted on the derotator, which tracks the sidereal rotation during an exposure.
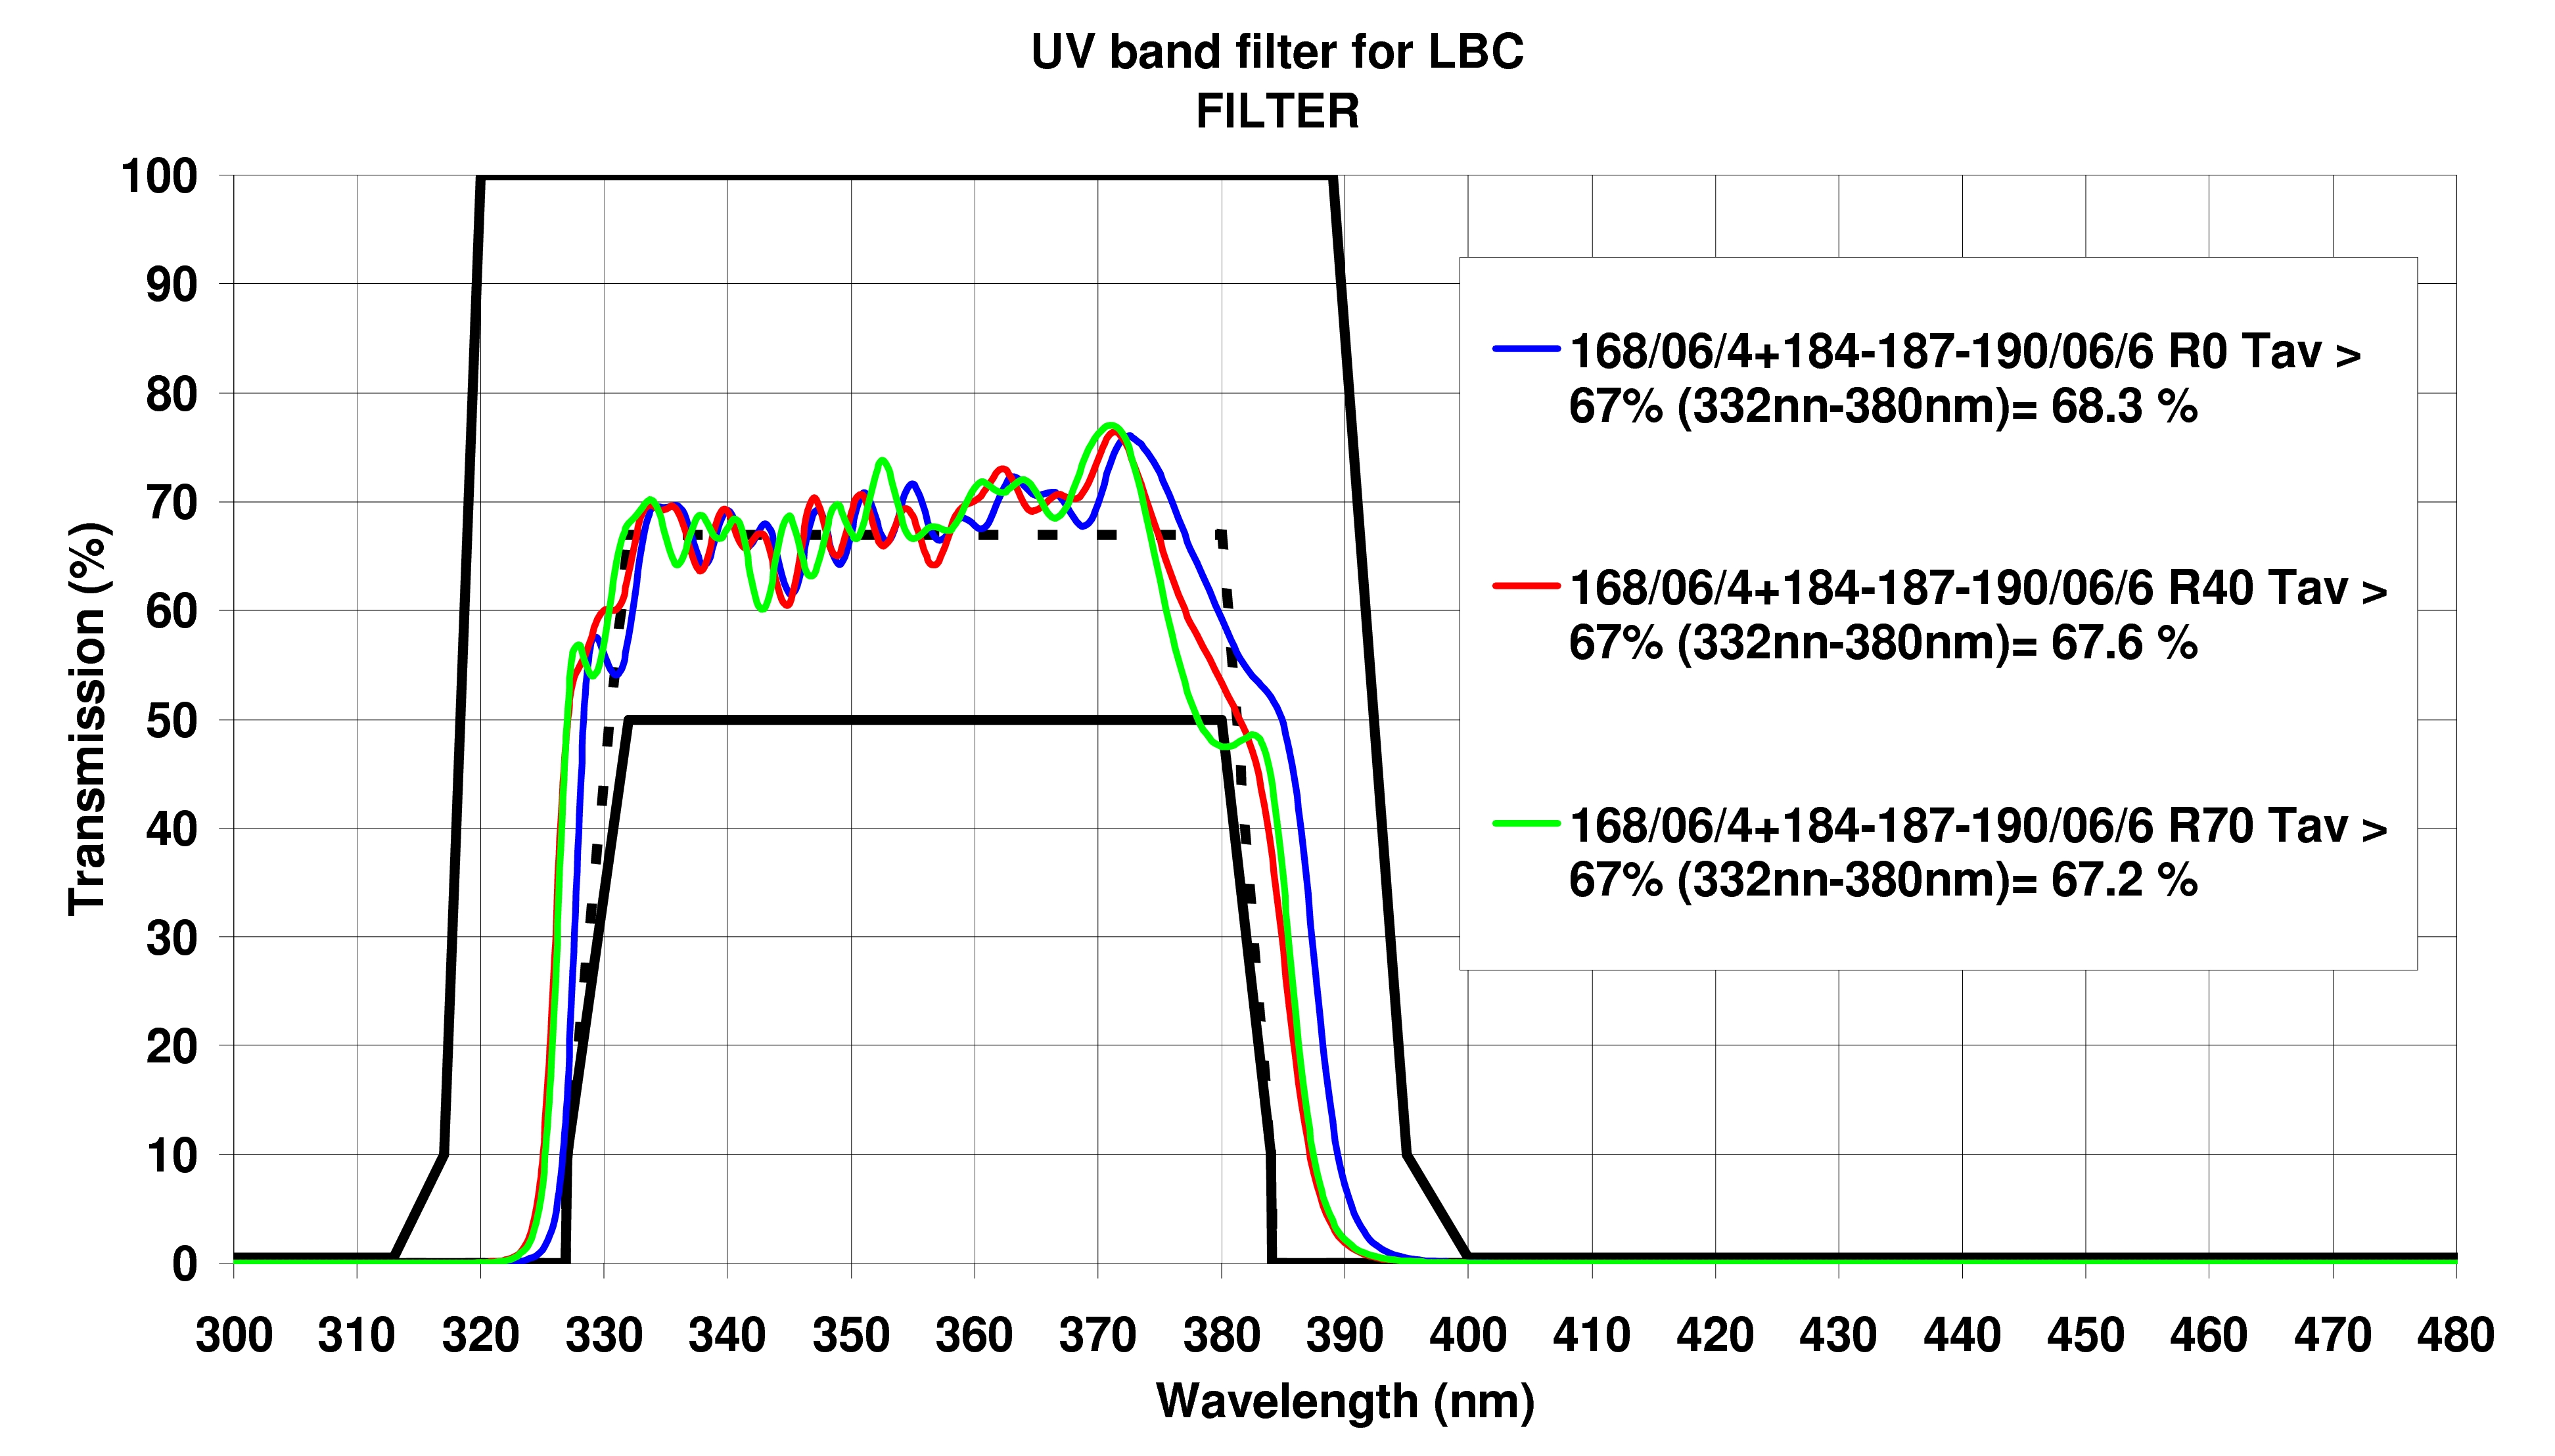
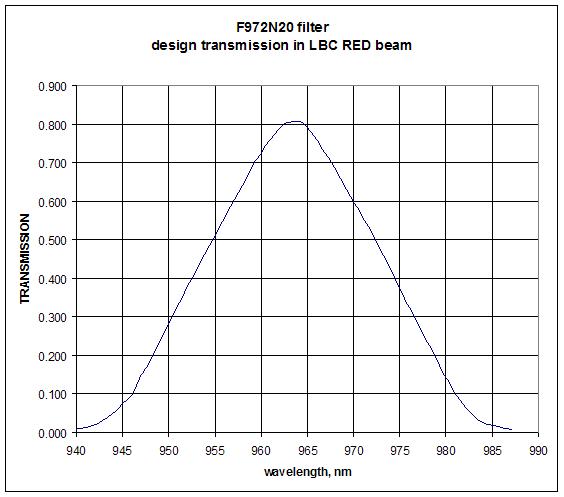
The tables below list some of the properties of the filters installed in LBC Blue and Red. Click on the filter name to see the plot of filter transmission and on the "ascii" link for the table. The plots show the curve based on the ascii file (solid black), which for all filters except the LBC-Blue U-Bessel, B-Bessel and V-Bessel and the LBC-Red filter, F972N20, are the actual measured transmission data. These data were measured in a collimated beam. These accurately represent the throughput through the wide glass filters in the convergent beam of LBC; but through the interference filters (the Sloan, Y-FAN and narrow-band F972N20 filter), the transmission in the convergent beam is blueshifted, and the FWHM broadened, from that measured in a collimated beam. The plots illustrate this effect, where the dotted black line plots the predicted transmission in a convergent f/1.45 beam.
The thicknesses, when available, are listed. The diameters of the Blue filters are 160 mm and, of the Red filters, 190 mm. (For more specific details send an email to sciops at lbto dot org).
| Filters in LBC Blue | ||||||
|---|---|---|---|---|---|---|
| Position1 | Filter Name2 | 50% cut on [nm]3 | 50% cut off[nm]3 | Peak Trans[%]3 | Thickness[mm]4 | Comments |
| 11 | empty | |||||
| 12 | U-BESSEL ascii | 333 | 382 | 62 | ||
| 13 | V-BESSEL ascii | 488 | 610 | 93 | ||
| 14 | SDT_Uspec5 ascii | |||||
| 15 | B-BESSEL ascii | 375 | 469 | 75 | ||
| 21 | empty | |||||
| 22 | r-SLOAN ascii #1 ascii #2 | 552 | 686 | 99 | #1 installed; #2 spare | |
| 23 | empty | |||||
| 24 | empty | |||||
| 25 | g-SLOAN ascii #1 ascii #2 | 397 | 550 | 95 |
| Filters in LBC Red | ||||||
|---|---|---|---|---|---|---|
| Position1 | Filter Name2 | 50% cut on [nm]3 | 50% cut off [nm]3 | Peak Trans[%] 3 | Thickness[mm]4 | Comments |
| 11 | empty | |||||
| 12 | r-SLOAN ascii | 553.3 | 686.6 | 98.7 | 8.7 | |
| 13 | I-BESSEL ascii | 713 | 881 | 97 | ||
| 14 | i-SLOAN ascii | 697.2 | 836.9 | 96.6 | 9.2 | |
| 15 | z-SLOAN6 ascii | 830.0 | 96.9 | 9.0 | ||
| 21 | empty | |||||
| 22 | R-BESSEL ascii | 572 | 690 | 79 | ||
| 237 | V-BESSEL ascii | 493 | 577 | 88 | ||
| 237 | TiO_7848 ascii | 769 | 788 | 97.8 | 8.49 | |
| 24 | F972N209 ascii9 | 952.5 | 974.5 | 81 | ||
| 257 | Y10 ascii | 952.5 | 1110.7 | 96.6 | 9.4 | |
| 257 | CN_8178 ascii | 802 | 821 | 97.8 | 8.49 |
2. Filter Name is as it appears in the Observing Block Preparation tool. Click on the filter name to see the transmission curve. Click on the 'ascii' to see tables of wavelength vs transmissivity (%). There were two g-SLOAN and two r-SLOAN filters manufactured for LBC-Blue and, hence, one curve for each filter.
3. Wavelength [nm] at which the transmission is 50% of its peak value. These values are based on theoretical curves which assume a convergent f/1.45 beam. For the TiO and CN filters, these values are those measured for a collimated beam, but with a blue shift of 5.97 nm for TiO and 6.22 nm for CN, applied. Values for peak transmission are all from the transmission as measured in a collimated beam.
4. Filter thicknesses are averages of several measurements made at positions along the edge, the outer few millimeters of each filter. Reported in email from Ray Bertram dated October 1, 2007.
5. The SDT_Uspec filter was purchased by the LBC-team.
6. The Sloan z' filter has no red cutoff.
7. These two positions in filter wheel 2 usually hold the V-Bessel and Y filters, however, when the narrow band TiO and CN filters are requested, they are swapped into these positions.
8. The TiO and CN filters were purchased by M. Frank (MPIA) but can be used by all. Because these are not in the filter wheel by default, the observers and PI should specifically indicate, in an email to sciops at lbto dot org, that they need these.
9. The F972N20 narrow band filter was provided by Haojing Yan.
10. The Y filter was provided by Xiaohui Fan.
Back to Top
Detector Quantum Efficiencies
| Blue Channel Detectors | ||||||
|---|---|---|---|---|---|---|
| CCD | 350 nm | 400 nm | 500 nm | 650 nm | 900 nm | 1000 nm |
| 8341-16-3 [CCD 1] | 53.8 | 81.3 | 85.4 | 78.8 | 28.3 | - |
| 8351-18-4 [CCD 2] | 56.1 | 83.7 | 88.2 | 80.1 | 27.3 | - |
| 9283-4-5 [CCD 3] | 53.8 | 81.1 | 83.8 | 76.8 | 27.4 | - |
| 9283-1-4 [CCD 4] | 56.3 | 77.7 | 80.5 | 75.0 | 28.3 | - |
| Red Channel Detectors | ||||||
|---|---|---|---|---|---|---|
| CCD | 350 nm | 400 nm | 500 nm | 650 nm | 900 nm | 1000 nm |
| 9434-17-3 [CCD 1] | - | - | 95.1 | 96.7 | 57.0 | 13.2 |
| 9434-16-5 [CCD 2] | - | - | 82.8 | 90.2 | 53.2 | 11.8 |
| 9434-15-3 [CCD 3] | - | - | 84.3 | 90.6 | 51.5 | 11.2 |
| 9434-15-4 [CCD 4] | - | - | 87.4 | 95.7 | 54.4 | 12.2 |
Detector Characteristics
The gain and readout noise for each of the science detectors are listed below. The dark current is almost negligible, 0.01 ADU/s. These data are from the LBC-Blue and Red commissioning documents prepared and provided by the LBC team.
The bias levels for the science detectors have been adjusted as work has been done on the controllers, so the current levels are not the same as those in the commissioning documents. Also, for both cameras, the bias levels are not stable throughout the night, in particular the bias level decreases after the camera is turned on and only reaches a stable value after 20-25 biases. The current, approximate, bias levels are listed in these tables.
| Blue Channel | ||||
|---|---|---|---|---|
| CCD | Gain (e-/ADU) | Readout Noise (ADU)1 | bias level (ADU) | date |
| chip 1 | 1.96 | 5.2 | 675 | April 2010 |
| chip 2 | 2.09 | 4.8 | 745 | April 2010 |
| chip 3 | 2.06 | 4.8 | 675 | April 2010 |
| chip 4 | 1.98 | 5.0 | 660 | April 2010 |
| tech chip 1 | 5.5 | |||
| tech chip 2 | 5.2 |
| Red Channel | ||||
|---|---|---|---|---|
| CCD | Gain (e-/ADU) | Readout Noise (ADU)1 | bias level (ADU) | date |
| chip 1 | 2.08 | 5.00 | 310 | April 2010 |
| chip 2 | 2.14 | 5.00 | 305 | April 2010 |
| chip 3 | 2.13 | 5.30 | 290 | April 2010 |
| chip 4 | 2.09 | 4.80 | 290 | April 2010 |
| tech chip 1 | 6.0 | |||
| tech chip 2 | 8.0 |
Back to Top
Zero Points and other Calibration Coefficients
Zero points through all filters in LBC Blue and all filters except the narrow-band PI filter F972N20 in LBC Red were determined from observations of the Landolt and the Galadi-Enriquez standard star fields made during the LBC Blue and Red commissioning periods. Color terms and extinction were also determined. The adopted calibrations relations, from the commissioning reports, were:| Calibration Coefficients for LBC Blue Filters | |||
|---|---|---|---|
| Filter | Zero Point | Color Term | Extinction |
| SDT_Uspec | 27.33 (0.02) | 0.220 (0.004)(u-g) | -0.47 (0.02) |
| U-BESSEL | 26.23 (0.03) | 0.036 (0.009)(u-b) | -0.48 (0.02) |
| B-BESSEL | 27.93 (0.02) | -0.123 (0.003)(b-v) | -0.22 (0.01) |
| V-BESSEL | 28.13 (0.01) | 0.021 (0.005)(b-v) | -0.15 (0.02) |
| g-SLOAN | 28.31 (0.01) | -0.086 (0.002)(g-r) | -0.17 (0.02) |
| r-SLOAN | 27.75 (0.01) | -0.016 (0.002)(g-r) | -0.11 (0.02) |
| Calibration Coefficients for LBC Red Filters | |||
|---|---|---|---|
| Filter | Zero Point | Color Term | Extinction |
| V-BESSEL | 27.94 (0.04) | -0.041 (0.019)(v-i) | -0.16 (0.03) |
| R-BESSEL | 27.86 (0.02) | 0.067 (0.009)(v-r) | -0.13 (0.01) |
| I-BESSEL | 27.59 (0.02) | 0.019 (0.005)(v-i) | -0.04 (0.01) |
| r-SLOAN | 28.03 (0.02) | -0.014 (0.008)(r-i) | -0.09 (0.02) |
| i-SLOAN | 27.57 (0.02) | -0.072 (0.005)(r-i) | -0.03 (0.01) |
| z-SLOAN | 27.20 (0.04) | -0.020 (0.004)(i-z) | -0.04 (0.02) |
| Y-FAN | 24.58 (0.08) | -0.05 (0.02) |
Sensitivities
The sensitivities are tabulated below for both Blue and Red cameras. The data are from the respective commissioning documents. The Exposure Time Calculator provides signal-to-noise and sensitivity estimates for a wide range of conditions, including moon phase and seeing.| Sensitivity Limits for LBC Blue Filters | |||
|---|---|---|---|
| Filter | Mag(AB) 1hr 10 sig | Mag(AB) 1hr 1 sig | Seeing (arcsec) |
| SDT_Uspec | 24.8 | 27.0 | 1.05 |
| U-BESSEL | 24.5 | 26.9 | 1.05 |
| B-BESSEL | 24.2 | 26.8 | 1.00 |
| V-BESSEL | 25.1 | 27.6 | 1.00 |
| g-SLOAN | 26.6 | 28.9 | 0.95 |
| r-SLOAN | 25.2 | 27.7 | 1.00 |
| Sensitivity Limits for LBC Red Filters | |||
|---|---|---|---|
| Filter | Mag(AB) 1hr 10 sig | Mag(AB) 1hr 1 sig | Seeing (arcsec) |
| V-BESSEL | 25.9 | 28.5 | 1.05 |
| R-BESSEL | 25.2 | 27.8 | 0.90 |
| I-BESSEL | 25.1 | 27.6 | 1.00 |
| r-SLOAN | 25.5 | 27.9 | 1.00 |
| i-SLOAN | 25.2 | 27.7 | 0.85 |
| z-SLOAN | 22.9 | 25.3 | 0.90 |
| Y-FAN | 22.7 | 25.2 | 0.85 |